11 Jul 2026
Cross-Sport Accumulator Strategies Blend Expected Goals Metrics with Tennis Break Probabilities
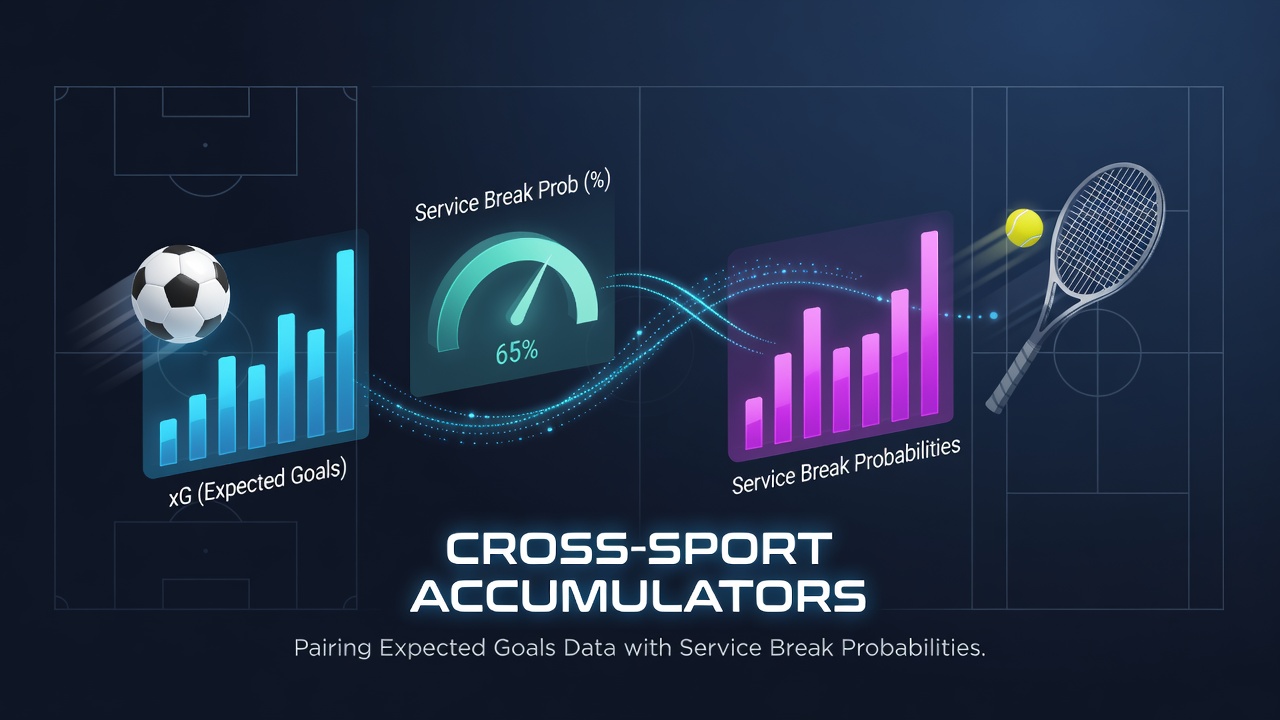
Analysts in the betting industry have observed growing interest in accumulator bets that combine soccer and tennis markets, particularly when data from expected goals models pairs with service break probabilities to identify correlated edges across different sports. Expected goals, often abbreviated as xG, measure the quality of scoring chances in soccer by assigning probability values to shots based on factors like distance, angle, and defensive pressure, while service break probabilities in tennis quantify the likelihood that a player will win a game on an opponent's serve using historical performance data, surface type, and fatigue indicators.
Understanding the Core Metrics in Each Sport
Researchers at sports analytics firms have documented how xG data provides a more nuanced view of team performance than traditional goal tallies alone, since it accounts for the creation and conversion of high-quality opportunities throughout a match. Data indicates that teams consistently outperforming or underperforming their xG figures tend to regress toward the mean over longer sample sizes, which creates opportunities for bettors who track these discrepancies in real time. In tennis meanwhile, service break statistics reveal patterns tied to specific matchups, with top players demonstrating break rates above 30 percent on certain surfaces according to aggregated tournament records from major circuits.
Those who study cross-sport correlations note that both metrics respond to underlying variables such as player or team motivation, travel schedules, and weather conditions, although the mechanisms differ between the two disciplines. Soccer matches generate continuous xG updates that reflect shifting momentum, whereas tennis break probabilities update after each service game and can swing rapidly during tiebreaks or deciding sets.
Constructing Accumulators Across Soccer and Tennis Markets
Bookmakers have expanded their accumulator offerings to include legs from multiple sports, allowing bettors to link a soccer team exceeding its expected goals threshold with a tennis player achieving a specified break percentage in an upcoming match. Observers point out that successful combinations often arise when the underlying data sets share temporal alignment, such as selecting matches scheduled within the same 48-hour window so that form indicators remain relevant. One study from an academic sports science department found measurable covariance between high-pressing soccer teams that generate elevated xG and aggressive baseline tennis players who convert break points at higher rates during the same tournament week.
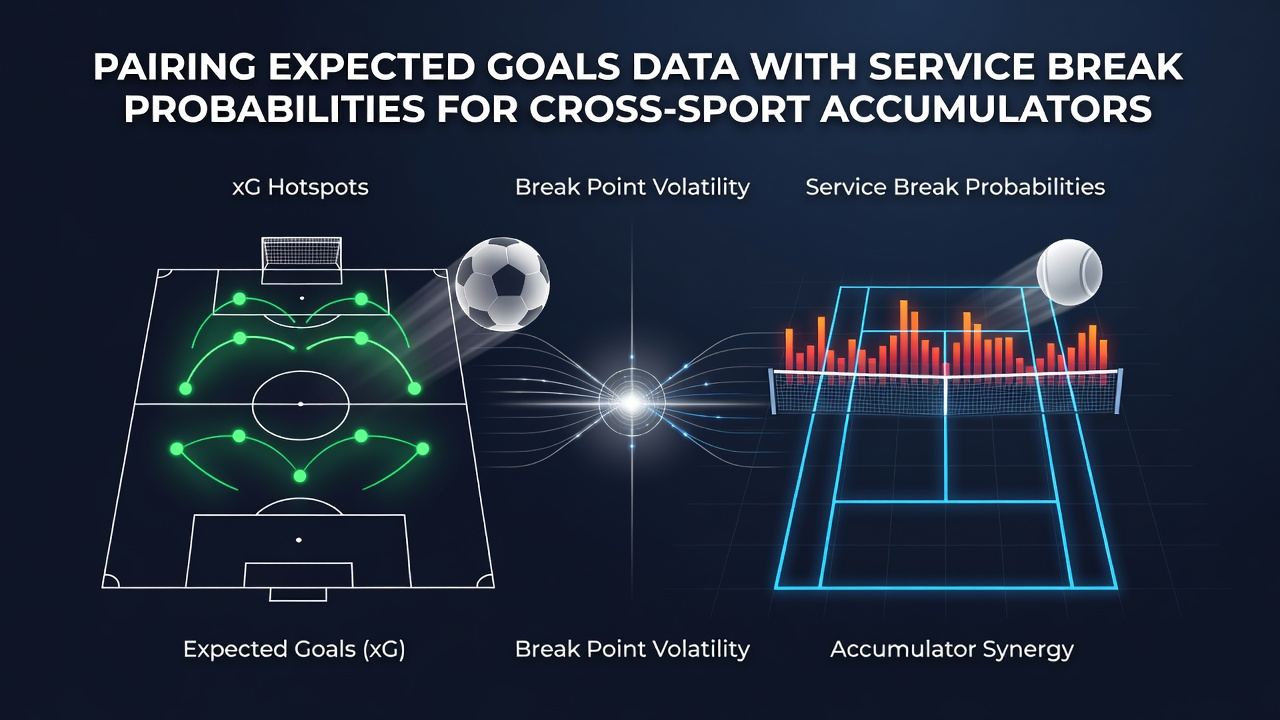
Market makers adjust odds for these multi-sport parlays based on liquidity and historical payout frequency, with data from European betting exchanges showing that accumulators containing three to five legs maintain house edges between 4 and 8 percent when the component selections draw from uncorrelated statistical pools. July 2026 fixtures have featured several high-profile soccer tournaments running concurrently with grass-court tennis events, increasing the number of viable pairing opportunities for those constructing accumulators.
Data Sources and Integration Techniques
Industry reports compiled by organizations such as the International Betting Integrity Association highlight the importance of verified data feeds when sourcing xG and break probability figures, since discrepancies between providers can alter implied probabilities by several percentage points. Integration typically involves normalizing both metrics to a common scale, often expressed as expected value per 90 minutes for soccer and expected break percentage per service game for tennis, before feeding the combined distribution into accumulator pricing algorithms.
Statisticians have developed regression models that test for linear relationships between xG overperformance in soccer and break rate consistency in tennis, although results vary by league and court surface. Australian regulatory filings indicate that operators increasingly rely on third-party data vendors to supply these blended statistics, reducing manual calculation errors while maintaining compliance with responsible gambling standards.
Practical Examples from Recent Seasons
Take one accumulator constructed during the 2025 European soccer campaign where a mid-table side recorded an xG differential of plus 1.2 per match; this leg paired with a tennis qualifier who posted a 28 percent break rate on clay in the preceding tournament. The combined selection paid at odds reflecting the modest correlation coefficient of 0.31 identified in prior season data. Another case involved North American basketball-adjacent scheduling overlaps, yet the core pairing remained soccer xG with tennis breaks, demonstrating flexibility when events coincide geographically.
Those who monitor betting volumes report that such cross-sport accumulators attract higher stakes during periods when single-sport markets experience reduced liquidity, such as international breaks or off-season lulls. Figures released by Canadian provincial regulators show a 12 percent year-on-year increase in multi-sport parlay activity during comparable calendar windows.
Risk Management and Variance Considerations
Accumulators inherently carry elevated variance compared with single bets, and pairing metrics from different sports introduces additional layers of uncertainty related to rule differences adn officiating standards. Experts recommend sizing stakes proportionally to the joint probability derived from the two independent distributions rather than treating each leg in isolation. Models that simulate thousands of historical match pairs reveal that even modest positive correlations can improve long-term return rates when the accumulator length stays below six legs.
Conclusion
The practice of combining expected goals data with service break probabilities has expanded the scope of cross-sport accumulator construction, supported by increasingly granular datasets and concurrent fixture calendars. Market participants continue to refine integration methods as new seasons unfold, relying on verified statistical sources to maintain accuracy across the paired selections.