4 Jun 2026
Leveraging Altitude Data to Enhance Projections for Mountainous Region Events

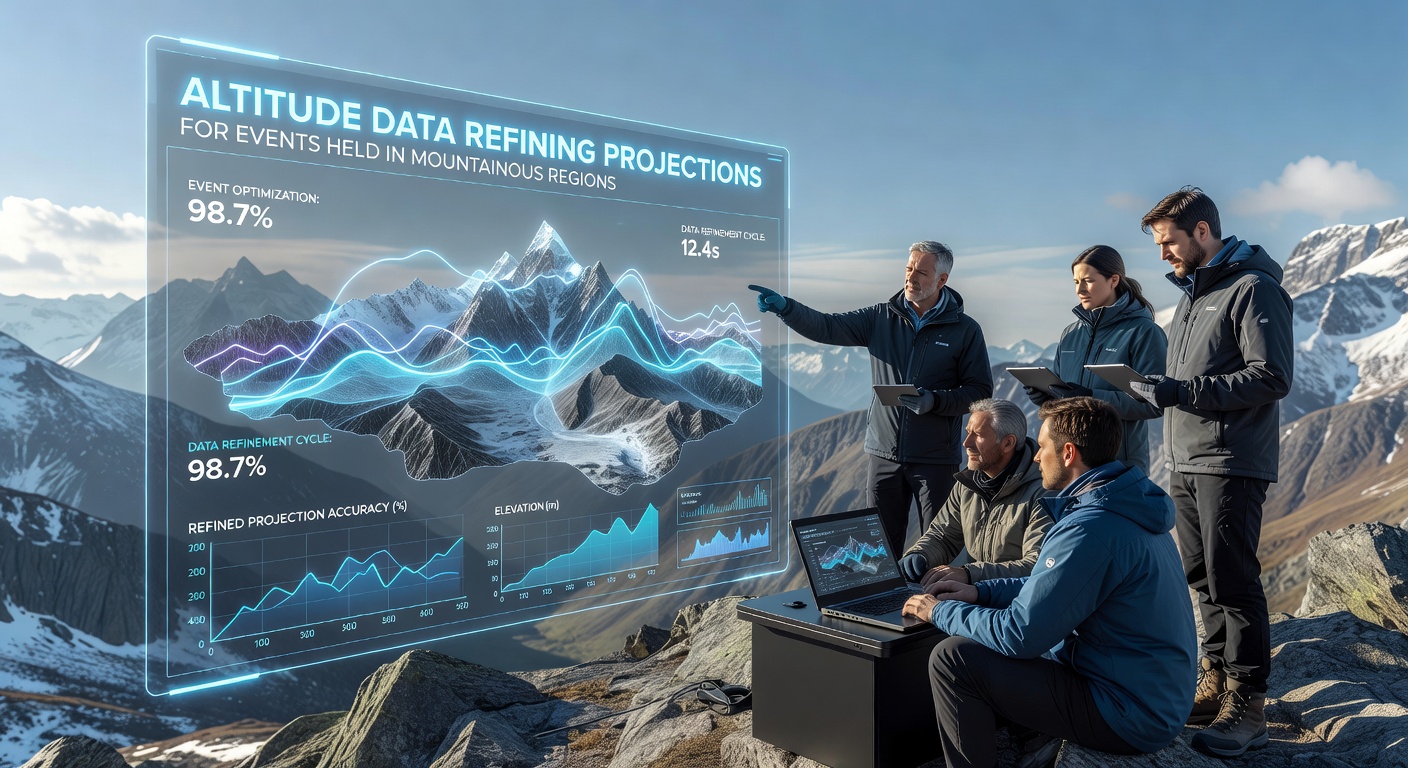
Altitude data plays a central role in refining projections for events held in mountainous regions, where elevation changes influence weather patterns, participant performance, and logistical requirements. Organizers rely on precise topographic datasets to adjust forecasts that account for rapid shifts in temperature, precipitation, and wind conditions across varying heights. Research from institutions like the University of Innsbruck shows elevation gradients can alter local climates by several degrees within short distances, which affects timing for races, festivals, and endurance challenges.
Data collection methods have evolved to include satellite imagery combined with ground sensors placed at multiple elevations, and these systems generate layered models that project conditions hour by hour. In June 2026, several European mountain venues plan to integrate updated Copernicus program datasets that provide finer resolution for alpine zones, allowing planners to anticipate snowmelt rates and visibility changes more accurately during summer events.
Key Components of Altitude-Informed Modeling
Projections start with digital elevation models that map every slope and ridge, then layer atmospheric variables such as barometric pressure and humidity readings collected from stations positioned at 500-meter increments. Analysts cross-reference these inputs with historical records spanning decades, which reveals recurring patterns like afternoon thunderstorms forming above 2,000 meters even when valleys remain clear. Organizations including the National Oceanic and Atmospheric Administration supply baseline grids that researchers refine through machine learning algorithms trained on regional case studies from the Rockies and the Alps.
Performance metrics for athletes receive similar treatment because oxygen availability drops roughly 10 percent for every 1,000 meters gained, and event coordinators adjust pacing guidelines accordingly. Studies conducted by teams at the University of Calgary demonstrate that endurance cyclists in high-altitude stages experience measurable reductions in power output that projection software now factors into route simulations. This approach helps medical teams preposition oxygen supplies and hydration stations at calculated intervals rather than relying on uniform spacing used at sea level.
Logistical Adjustments Driven by Elevation Data
Supply chains for equipment and personnel also depend on altitude-adjusted projections, since vehicle performance and fuel consumption change with thinner air. Event managers in the Canadian Rockies have adopted routing software that incorporates grade and elevation data to predict delivery times for temporary structures, while emergency response teams use the same models to estimate helicopter payload limits during rescue scenarios. Figures from the Swiss Federal Office for the Environment indicate that such integrated planning reduces weather-related delays by measurable percentages when compared with earlier methods that treated entire venues as single elevation points.
Communication networks require parallel consideration because signal propagation varies with elevation and terrain shadowing. Technicians deploy repeaters at strategic heights identified through propagation modeling tools, and these placements ensure consistent connectivity for timing systems and live broadcasts even when primary towers sit in valleys. Observers note that events scheduled for June 2026 in the Pyrenees have already incorporated revised signal maps derived from recent LiDAR surveys to prevent coverage gaps during peak attendance periods.
Case Examples from Recent Seasons
One multi-stage cycling event held in the Sierra Nevada applied altitude-specific weather projections to reschedule a mountain-top finish after models indicated an incoming cold front would drop temperatures below safety thresholds for spectators. The adjustment occurred 36 hours in advance, which allowed broadcasters and support crews to relocate operations without last-minute disruption. Similar refinements appear in trail running competitions across the Andes, where organizers now publish elevation-banded start times that stagger waves according to projected heat stress indices calculated at each altitude band.
Academic papers published through the International Society of Mountain Medicine further support these practices by documenting how refined projections correlate with lower incident rates when hydration and acclimatization protocols align with actual elevation profiles rather than average venue heights. Data from multiple seasons continues to feed back into the modeling systems, creating iterative improvements that benefit subsequent events.
Conclusion
Altitude data continues to sharpen the accuracy of projections that underpin safe and efficient operations for events in mountainous regions. Integration of high-resolution elevation layers with atmospheric and physiological variables produces forecasts that reflect real terrain complexity, while ongoing updates from satellite programs and ground networks maintain relevance for planners. As datasets from June 2026 deployments become available, further calibration of these models will support even more precise scheduling and resource allocation across diverse mountain venues worldwide.