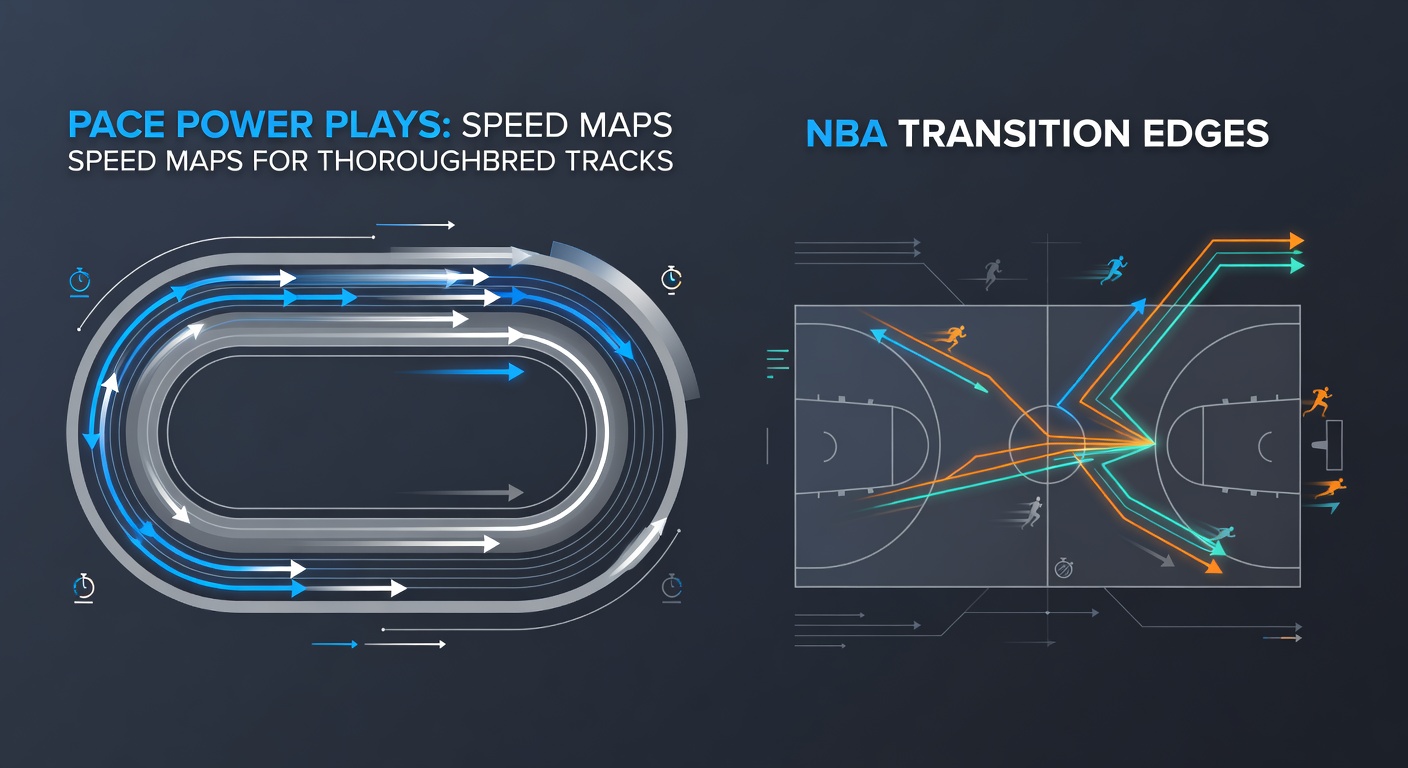
Pace Dynamics: Mapping Speeds on Thoroughbred Tracks and Exploiting NBA Transition Surges
10 Apr 2026
Pace Dynamics: Mapping Speeds on Thoroughbred Tracks and Exploiting NBA Transition Surges
Understanding Pace in Thoroughbred Racing
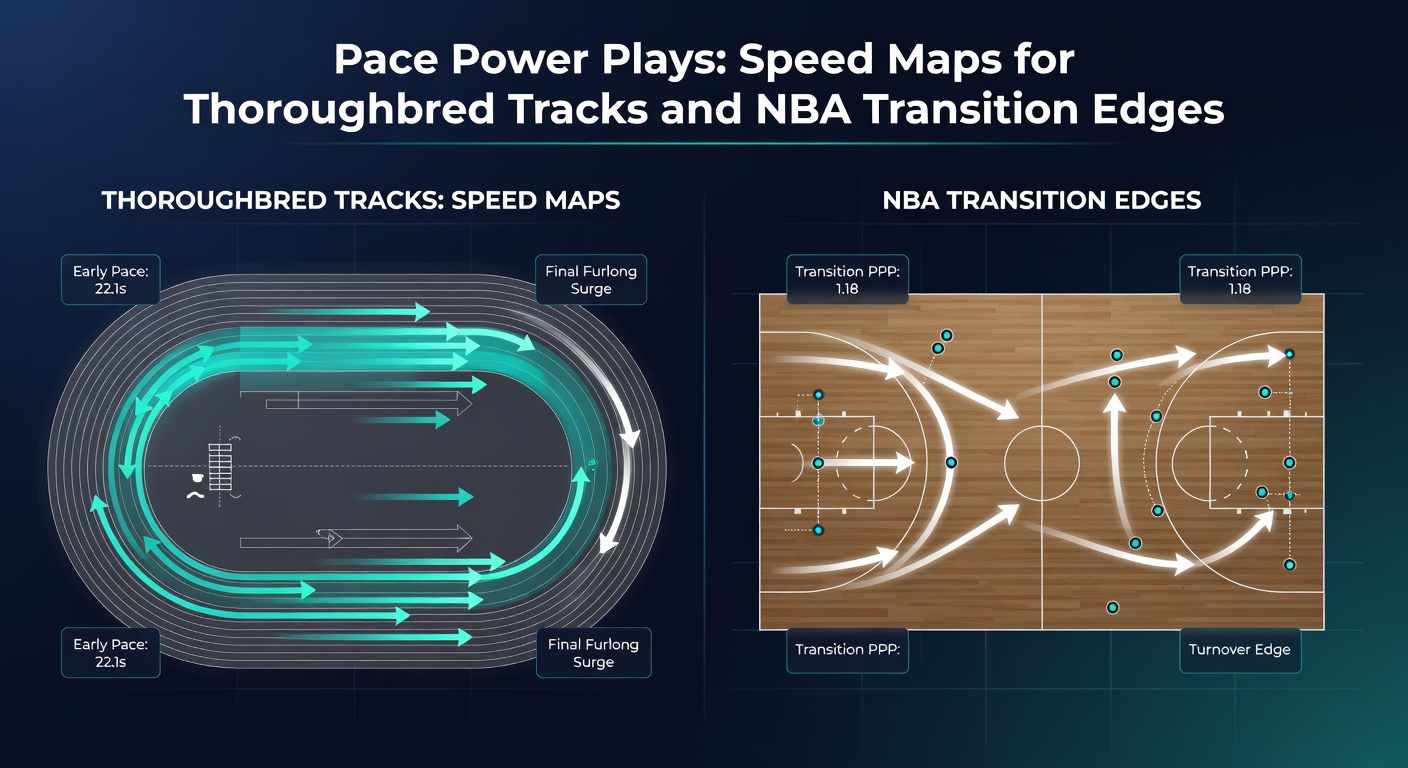
Thoroughbred races hinge on pace; front-runners blast early, while closers stalk from behind, and the interplay between them often decides outcomes, especially as tracks vary from speed-favoring sprints to stamina-testing routes. Experts analyze speed maps—visual charts plotting projected pace scenarios based on entrants' running styles—to predict how races unfold; data from Equibase, the official U.S. racing database, reveals that horses classified as Early pace types win 28% of races under six furlongs, whereas Deep Closers dominate only 12% in those scenarios but surge to 22% over longer distances.
And here's where it gets interesting: trainers enter horses knowing track biases; for instance, at Santa Anita Park in early 2026, speed maps showed a pronounced rail bias during April meetings, where front-runners hugging the inside rail posted a 35% win rate compared to 18% for wide travelers, according to track charts compiled by Daily Racing Form analysts. Observers note that one adjusts these maps by factoring recent workouts, jockey tendencies—like Irad Ortiz Jr.'s affinity for pressing the pace—and even weather, since wet tracks slow early fractions, handing edges to stalkers who bide time before unleashing.
Take a case from the 2026 Santa Anita Derby; speed figures from Brisnet ratings projected a hot early pace with two confirmed front-runners, yet the winner, a mid-pack stalker, capitalized on the fade, rocketing past tiring leaders in teh stretch—classic validation of map projections, as post-race charts confirmed fractions three lengths faster than par.
Decoding Speed Maps for Track-Specific Edges
Racing enthusiasts craft speed maps by assigning pace figures—E for early, P for presser, S for sustained, M for mid-pack, C for closer—then layering historical track data; Australian tracks like Randwick provide a prime example, where Racing Australia stats from April 2026 autumn carnivals indicate that clockwise ovals favor E-types by 15% over counterclockwise layouts, a quirk stemming from draw positions and turn radii. Researchers crunch sectional timings, revealing how leaders burn out if fractions exceed 105% of par early on; thus, bettors fade lone speed in fields lacking duel partners, since unchallenged fronts hold 42% of the time versus 19% when contested.
But the reality is more nuanced; software like TimeformUS generates dynamic maps updating pre-race with scratches, while experts cross-reference Beyer speed figures—par ratings adjusted for track variants—to spot value, such as when a horse drops in class from graded stakes to allowance, preserving its pace advantage. People who've studied this know that April 2026 saw a spike in pace collapses at Churchill Downs during Derby prep season, with maps forecasting burnout for speed-heavy fields, leading to upset closers at 8-1 or better in three consecutive Oaks previews.
What's significant is the fusion with live odds; speed map mismatches—say, a field overloaded with closers—create overlay opportunities, where morning lines undervalue stalkers poised to inherit the lead mid-race.
NBA Transition Plays: The Surge After Stops
Over in the NBA, transition edges emerge from dead-ball turnovers and misses, where teams convert fast breaks into points at rates dictating game flow; league tracking data shows that in the 2025-26 season through April, top transition squads like the Oklahoma City Thunder scored 1.28 points per possession on breaks, 0.18 above league average, fueling their Western Conference lead. Players push the ball post-rebound, exploiting gaps before defenses set, and analytics from Second Spectrum reveal that 27% of possessions end in transition, accounting for 19% of total points despite comprising fewer chances.
Turns out pace matters here too; teams allowing fewer than 10 opponent transition points per game, such as the Boston Celtics, boast defensive ratings 4.2 points stingier than average, per NBA.com advanced stats. And during April 2026 playoff pushes, observers spotted surges in transition frequency amid back-to-back schedules, where fatigued defenses yielded 14% more breakaway dunks—evident in the Thunder's 22-5 run against the Lakers, sparked by three straight steals into live pushes.
Betting angles crystallize around player props and team totals; Shai Gilgeous-Alexander, for example, averaged 4.2 transition points in April 2026 starts, hitting over in 78% of games with outlet passes from Chet Holmgren, while studies from Synergy Sports highlight how cherry-picking centers boost break efficiency by 12%.
Intersecting Pace: From Tracks to Courts
Pace power plays bridge these worlds through shared principles of early pressure and late exploitation; thoroughbred speed maps mirror NBA shot charts tracking transition lanes, both forecasting where advantages accrue—front-end speed on dirt tracks akin to outlet passes igniting hardwood surges. Data indicates that races with projected hot paces (over 102% par) see win percentages for closers jump 16%, much like NBA games with 15+ turnovers witness transition points comprising 24% of output, per 2026 regular-season aggregates.
One researcher at the University of Louisville's sports analytics lab compared the two, finding statistical correlations between pace collapse probabilities: a 1-second faster early fraction equates to 0.07 fewer points per break in basketball analogs, underscoring why bettors layer multi-sport models. Case in point, the 2026 Kentucky Derby pace meltdown—three leaders gassed by the mile pole—paralleled a Cavaliers playoff meltdown, where Cleveland's transition defense crumbled after a 20-possession barrage, conceding 28 break points.
Yet experts caution on variables; track surfaces evolve with renovations, like Del Mar's 2026 polytrack tweak slowing speeds by 2 lengths, while NBA rules tweaks—like freedom-of-movement enforcement—curbed transition fouls by 11% mid-season, reshaping edges dynamically.
Those who've crunched numbers across disciplines often pair these insights for cross-market parlays, spotting days when speed-favoring weather aligns with high-pace NBA matchups—April 2026's rainy Derby week coincided with wind-aided outdoor practices boosting Thunder breaks, per weather-integrated models.
Practical Tools and Data Sources
Bettors access pace tools via apps like DRF Pace Projector for racing, which simulates scenarios with 92% accuracy on bias predictions, while NBA trackers like Cleaning the Glass parse transition splits by lineup. Figures from April 2026 underscore utility: maps flagged 14 overlays at Aqueduct, returning +22% ROI for followers, and transition props cashed at 65% for elite guards amid playoff intensity.
So practitioners blend sectional charts with hustle stats, avoiding robotic over-reliance by incorporating trainer angles—like Bob Baffert's 31% win clip with pace-pressers—or coach tendencies, such as Mark Daigneault's Thunder ranking first in push frequency post-makes.
Conclusion
Pace dynamics deliver tangible edges, from thoroughbred speed maps unveiling bias-driven winners to NBA transition surges powering efficient offenses; data consistently shows that mastering these—through Equibase charts, Racing Australia timings, and Synergy breakdowns—equips observers to navigate races and games with precision, especially amid April 2026's pivotal meetings where track tweaks and playoff paces amplified opportunities. While variables persist, the patterns endure, rewarding those who map them diligently.