19 May 2026
When Form Meets Fatigue: Analyzing Back-to-Back Scheduling Impacts on Daily Football and Basketball Picks

Back-to-back scheduling creates measurable shifts in team output across football and basketball, and analysts track these patterns to refine daily picks with greater precision. Congested calendars force players into repeated high-intensity efforts with limited recovery windows, which data from multiple leagues shows can alter key performance indicators such as shot accuracy, passing completion, and defensive positioning. Observers note that basketball schedules in professional circuits often pack games on consecutive nights, whereas football encounters tighter turnarounds mainly during cup runs or international windows, yet both sports reveal consistent fatigue signatures when fixtures pile up.
Researchers at sports science institutions have quantified how limited rest intervals reduce sprint frequency and decision-making speed in basketball, while football data sets highlight drops in high-intensity runs after midweek matches followed by weekend league games. These patterns surface most clearly during playoff pushes or European competition stretches, where teams log extra travel miles on top of the physical load. In May 2026, several basketball conferences wrap regular-season play with compressed schedules that feed directly into postseason brackets, giving bettors fresh datasets to compare rested squads against those coming off quick turnarounds.
Quantifying Fatigue Through Performance Metrics
League tracking systems record minute-by-minute workload, allowing statisticians to isolate the effects of consecutive games on individual and collective output. Basketball studies consistently report a 4 to 7 percent decline in effective field-goal percentage for teams playing their second contest in as many nights, according to aggregated box-score reviews from recent seasons. Football analysts apply similar methods to pressing intensity and set-piece conversion, noting that squads with fewer than 72 hours between matches concede more shots from distance when legs tire late in contests.
What's interesting is how these decrements compound across positions. Guards and wing players in basketball log the highest distances on back-to-backs, while football midfielders show the sharpest reductions in successful tackles when recovery time shrinks. Bettors who incorporate rest differentials into models often adjust totals downward for high-scoring expectations and shift focus toward underdog covers when the fresher side dictates tempo. External data sources such as the International Journal of Sports Physiology and Performance provide peer-reviewed benchmarks that support these adjustments across both codes.
Daily Pick Adjustments Based on Schedule Density
Successful daily selections integrate schedule density alongside traditional form indicators. One approach involves layering rest metrics onto player-prop markets, where basketball wings coming off back-to-backs post lower rebound and assist averages in the subsequent outing. Football markets respond similarly when clubs rotate squads after European midweek fixtures, with corner and card counts rising as defensive organization loosens. Those who monitor official league schedule releases early can flag these mismatches before odds adjust fully.
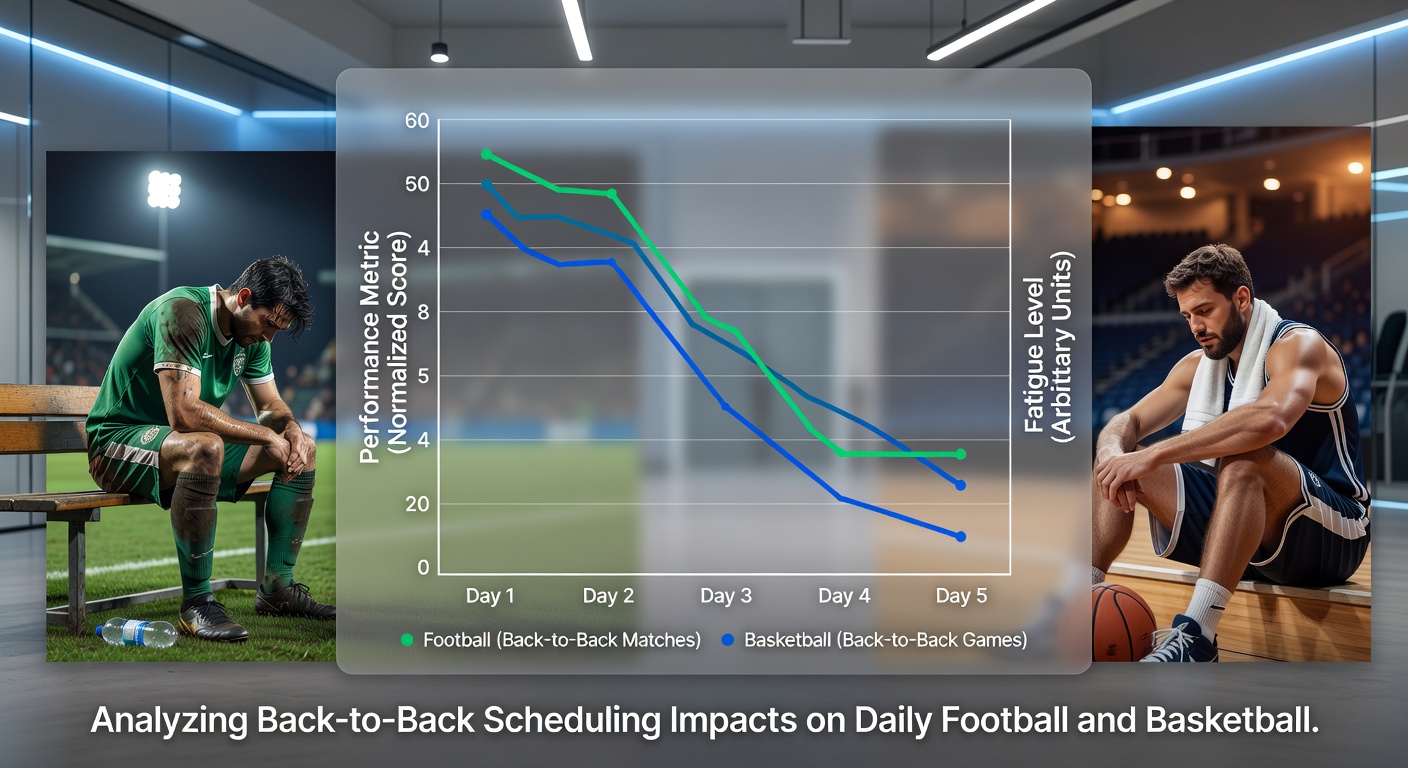
Another layer appears in live betting windows, where fatigue becomes visible through declining press triggers or slower transition defense. Data indicates that basketball teams in the second half of a back-to-back allow more transition points after the 30-minute mark, while football sides under similar constraints surrender set-piece opportunities at higher rates. Punters who cross-reference real-time tracking feeds with pre-match rest data gain edges in both pre-game and in-play selections. A separate analysis published by the American College of Sports Medicine underscores how cumulative load across multiple back-to-backs further amplifies these effects during extended playoff runs.
Seasonal Patterns and Market Implications
Throughout any given campaign, clusters of back-to-back fixtures align with holiday periods, weather disruptions, or broadcast-driven rescheduling. Basketball exhibits the highest density during January and February stretches, whereas football sees spikes around December and March international breaks. Bettors who maintain rolling databases of rest differentials can isolate value in overs or unders markets when one side enters with superior recovery time. Historical aggregates reveal that rested teams cover the spread more frequently in both sports, though the margin narrows once coaching adjustments and tactical familiarity enter the equation.
May 2026 schedules in several basketball leagues feature final regular-season games squeezed before conference tournaments, creating a brief window where fatigue data becomes especially predictive. Football calendars meanwhile shift toward domestic cup finals and league deciders, where one or two clubs often carry heavier midweek loads. Observers tracking these overlaps find repeated opportunities in player-specific props and team totals when rest gaps exceed 48 hours.
Conclusion
Back-to-back scheduling leaves measurable footprints across football and basketball performance records, and those footprints translate directly into refined daily pick construction. By combining workload tracking, recovery timelines, and league-specific patterns, analysts build models that account for fatigue without discarding core form signals. As calendars evolve and data collection grows more granular, the intersection of schedule density and output metrics continues to shape how markets price short-term edges in both sports.